Abstract
Neuroglia critically shape the brain´s response to ischemic stroke. However, their phenotypic heterogeneity impedes a holistic understanding of the cellular composition of the early ischemic lesion. Here we present a single cell resolution transcriptomics dataset of the brain´s acute response to infarction. Oligodendrocyte lineage cells and astrocytes range among the most transcriptionally perturbed populations and exhibit infarction- and subtype-specific molecular signatures. Specifically, we find infarction restricted proliferating oligodendrocyte precursor cells (OPCs), mature oligodendrocytes and reactive astrocytes, exhibiting transcriptional commonalities in response to ischemic injury. OPCs and reactive astrocytes are involved in a shared immuno-glial cross talk with stroke-specific myeloid cells. Within the perilesional zone, osteopontin positive myeloid cells accumulate in close proximity to CD44+ proliferating OPCs and reactive astrocytes. In vitro, osteopontin increases the migratory capacity of OPCs. Collectively, our study highlights molecular cross talk events which might govern the cellular composition of acutely infarcted brain tissue.
Introduction
The brain is among the most metabolically costly mammalian organs1 and hence particularly vulnerable to ischemia2. The sudden deprivation of oxygen and substrate availability in the brain parenchyma triggers a cascade of complex pathophysiological events, culminating in the loss of neural tissue and lasting neurological dysfunction2,3. In humans, this oxygen and substrate deprivation is most often caused by an acute, critical reduction of cerebral blood flow, due to the occlusion of large cerebral arteries, the most common cause of ischemic stroke3.
Ischemic stroke is the second leading cause of disability and death worldwide and the global disease burden of ischemic stroke has been predicted to increase4. Apart from supportive care, all currently approved acute treatment strategies, that is thrombolysis and mechanical thrombectomy, aim to reinstate cerebral blood flow and are generally only effective when initiated within a timeframe of under 24 h after stroke onset5. Therefore, the lack of treatment strategies directed at neural tissue regeneration constitutes an important unmet therapeutic need. Nevertheless, spontaneous, albeit typically incomplete, regain of function after stroke is common and already observable within the acute phase of recovery, ranging from approximately 1 to 7 days6,7. Numerous endogenous recovery mechanisms of the injured CNS have thus been postulated8.
Cerebral ischemia triggers a breakdown of neurovascular unit (NVU) integrity, inflammation, neuronal cell death, and white matter injury9,10. This tissue damage is met with pronounced transcriptional, biochemical, and morphological changes in glial cells, including reactive astrogliosis and early remyelination10,11. However, current knowledge on the phenotypic heterogeneity within each reactive cell type and their precise interactions during the acute recovery from cerebral ischemic injury is still limited. Single-cell sequencing technologies have proven to be highly effective in addressing the challenges posed by the complex cellular heterogeneity of the CNS, in health and disease12. Arguably, most efforts in dissecting single-cell transcriptomes after cerebral ischemia have been directed at immune and vascular cells13,14,15,16,17,18. Thus far, particularly few studies have captured sufficient oligodendrocyte linage cells to identify robust subtype-specific transcriptional changes following stroke19,20. Moreover, extensive transcriptional comparisons between reactivated astrocytes and oligodendrocyte lineage cells in response to cerebral ischemia are still lacking.
Here we present a large-scale single-nucleus transcriptome dataset of the brain´s acute response to ischemic stroke. We dissect subtype-specific transcriptional signatures of stroke reactive neuroglia, compare subtype-specific astrocyte and oligodendrocyte lineage cell responses and contrast these changes with gene expressional profiles found in other CNS injuries. Our study highlights common immuno-glial molecular crosstalk events between myeloid cells, oligodendrocyte precursor cells (OPC), and reactive astrocytes, which might shape the cellular composition and microenvironment during early post-ischemic neural regeneration.
Results
MCAO alters CNS cell type composition and induces cell type-specific transcriptional changes
Here we used a rat model of permanent middle cerebral artery occlusion (MCAO) to investigate acute cell type specific transcriptional perturbations, at single-cell resolution in the acute phase following cerebral ischemic injury (Fig. 1a).
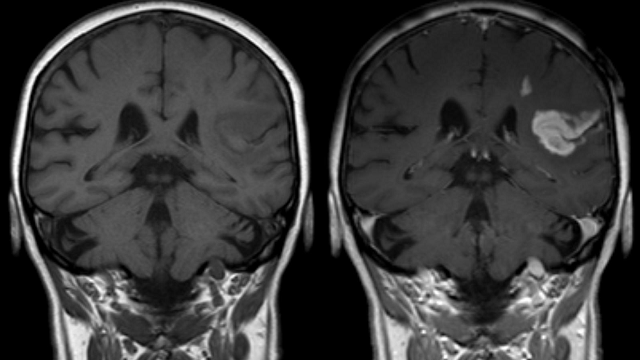
The induction of ischemic brain tissue damage was validated by MRI imaging 48 h after injury (Supplementary Fig. 1a–e). Hyper-intense lesions on T2 weighted MRI images were absent from all Sham-operated rats (n = 4) (Supplementary Fig. 1b), while animals from the MCAO group (n = 7) exhibited pronounced ischemic lesions ranging from 35.01 to 617.2 mm3, which we further stratified into moderate MCAO (mMCAO) (59.6 ± 39.2, n = 3) and severe MCAO (sMCAO) (449.5 ± 132.5, n = 4) infarctions (Fig. 1a, Supplementary Fig. 1c–e). Importantly, T2 hyper-intense lesions (Supplementary Fig. 2a) closely correlated with myelin and neuronal loss, as evidenced by LFB (Supplementary Fig. 2b) and MAP2 immunofluorescence staining (Supplementary Fig. 2c, d), respectively.
The selection of coronal tissue sections for snRNAseq was guided by MRI data. The maximum extent of the ischemic brain lesions was localized approximately between Bregma anterior-posterior +1.5 mm and −2 mm, in all MCAO samples, thus this region was selected for snRNAseq (Supplementary Fig. 1a–d). Left and right hemispheres were sequenced separately. Hence, we obtained datasets from the left and right hemispheres of Sham-operated rats (Sham L and Sham R, respectively), as well as left (=contralateral to ischemic lesion) and right (=ipsilateral to ischemic lesions) hemispheres of mMCAO and sMCAO infarcted rats (mMCAO contra, mMCAO ipsi, sMCAO contra, sMCAO ipsi, respectively) (Fig. 1a).
Following quality control (Supplementary Fig. 3a–d), we performed unbiased clustering analysis, which grouped all nuclei into 6 non-neuronal and 23 neuronal (12 glutamatergic, 1 cholinergic, 10 GABAergic) major cell clusters (Fig. 1b), using well-established marker genes (Fig. 1c–e). We identified three neuroglia clusters, specifically one immature and one myelinating/mature oligodendrocyte lineage cluster (OLIGO_1 and OLIGO_2, respectively) and one astrocyte clusters (AC), as well as one ependymal and mural cell cluster (EP_M_C), one vascular cell cluster, enriched for endothelial and pericyte transcripts (VASC) and one myeloid cell cluster (MC). Glutamatergic neurons were broadly split into isocortical, Satb2 expressing (GLU_Satb2+) and allocortical and deep grey matter, Satb2 negative glutamatergic neurons (GLU_Satb2−). GLU_Satb2+ neurons were further segregated using cortical layer-specific markers. We identified one cholinergic interneuron cluster (CHOL_IN). GABAergic neurons grouped into various interneuron (GABA_IN) and medium spiny neuron populations (GABA_MSN). GABA_IN were moreover separated into various Adarb2 positive (GABA_IN_Adarb2+), thus likely caudal ganglionic eminence (CGE) derived and Adarb2 negative (GABA_IN_Adarb2−), thus likely medial ganglionic eminence (MGE) derived inhibitory interneuron clusters. One GABAergic cluster could not be characterized using known inhibitory interneuron subset specific markers and was thus termed ambiguous GABAergic neuronal cluster (GABA_Amb). A detailed description of this and all following sub-clustering analyses is given in the supplementary notes, nuclei counts and cluster markers are reported in Supplementary Data 1.
Most of the clusters were represented in all datasets (Fig. 1f, Supplementary Fig. 3e). As expected, neuronal clusters were depleted in the dataset derived from severely infarcted tissue (Fig. 1f, Supplementary Fig. 3e). Most notably, almost all captured MC transcriptomes were derived from infarcted tissue (Fig. 1f, g). Their transcriptional signature significantly overlapped with the gene expression profile of stroke-associated myeloid cells (SAMC)13 (Fig. 1h, Supplementary Fig. 4a) and they expressed both canonical microglia and macrophage, but not lymphocyte markers (Supplementary Fig. 4b). Sub-clustering analyses of the MC cluster revealed two microglia (MG_0, MG_1), three macrophage transcript enriched (MΦe_1 to 3) and one smaller dendritic cell (DC) cluster (Supplementary Fig. 4c, d).
Notably, the expression of SAMC signature genes was well-conserved across MG_1 and MΦe_1 to 3 (Supplementary Fig. 4d, e), suggesting that microglia and macrophages converge onto a common phenotype within infarcted brain parenchyma, as previously reported13. We then systematically assessed overlaps between the gene signatures of the stroke-enriched myeloid cell subclusters in our datasets and previously described microglia and macrophage gene expression profiles in normal development and various neuropathologies (Supplementary Data 2). MG_1 and MΦe_1 to 3 exhibited robust enrichment for axon tract-associated microglia (ATM)21 and disease-associated microglia (DAM) but not disease inflammatory macrophage (DIM)22 associated transcripts (Supplementary Fig. 4d, e). Furthermore, these clusters overlapped clearly with the transcriptional phenotype of “foamy” microglia enriched in multiple sclerosis (MS) chronic active lesion edges23, while the profile of iron-associated and activated MS microglia23,24 was more restricted to MΦe clusters and less prominently represented in our dataset. Likewise, the upregulation of protein synthesis-associated genes (e.g. Rpl13, Rplp1) typical for iron metabolism associated and activated MS microglia23,24, was largely restricted to MΦe clusters. Other MS-associated myeloid cell profiles (for example, associated with chronic lesions, antigen presentation and phagocytosis) mapped more diffusely over all myeloid cell clusters (Supplementary Fig. 4e). Lastly, microglia but not macrophage-enriched clusters expressed genes (e.g. Cdc45, Mki67, Top2a) associated to cell proliferation by cell cycle scoring and enrichment analysis (Supplementary Fig. 4d, f). Enrichment analysis of MΦe cluster markers highlighted various degranulation, endo-/phagocytosis, as well as iron and lipid transport and metabolism-related processes and indicated the production of and reaction to reactive oxygen (ROS) and nitrogen species (RNS) (Supplementary Fig. 4g, h). Notably, some of the genes involved in these processes (e.g. Dab2, Lrp1, Ctsd) were also partially enriched in MG_1 (Supplementary Fig. 4i). Interestingly, macrophage transcript enriched clusters were more abundant in severely as compared to moderately infarcted brain tissue (Supplementary Fig. 5a, b). However, the transcriptional profiles of the individual myeloid cell subclusters did not differ substantially between the two infarction severities (Supplementary Fig. 5c–e). Taken together, these findings underpin the emergence of the SAMC phenotype in the infarcted brain parenchyma and additionally highlight shared and distinct transcriptional signatures of stroke-associated myeloid cell subsets.
We next investigated transcriptional perturbations induced by cerebral ischemia within those major cell clusters, which were represented in all datasets. No major transcriptional differences between the left and right hemisphere derived from Sham control animals were identified (Supplementary Fig. 6a, b). Although, cluster OLIGO_2 contained more nuclei in Sham R, as compared to Sham L (Fig. 1f), 0 DEGs were derived from the comparison of OLIGO_2 transcriptional profiles between both Sham hemispheres (Supplementary Fig. 6a, b). We, thus deemed the differential nuclei abundance in Sham R in this cluster to most likely be a technical artefact. Therefore, the two Sham datasets were pooled in all subsequent analysis. We next separately compared the datasets derived from moderately and severely infarcted hemispheres (mMCAO and sMCAO ispi, respectively) to the pooled Sham dataset. Both comparisons yielded a similar DEG distribution, with astrocyte and oligodendrocyte lineage cells emerging as the most reactive populations (Supplementary Fig. 6c, d). Therefore, and to increase the statistical power and hence robustness of our analysis we pooled the mMCAO and sMCAO datasets and performed subsequent cluster-wise comparisons against the pooled Sham and MCAO contra datasets. The majority of DEGs were derived from neuroglia clusters in both DEG calculations (Fig. 1i, Supplementary Fig. 6e, f). With the exception of OLIGO_1 and OLIGO_2, the gene expression profiles of clusters from the MCAO contra group and their Sham counterparts were mostly similar (Supplementary Fig. 6g). The comparisons of the MCAO ipsi datasets to either Sham or MCAO contra datasets consistently unveiled a higher number of DEGs in excitatory neuronal clusters, as compared to inhibitory neuronal clusters (Fig. 1f, Supplementary Fig. 6.c-f, Supplementary Fig. 7a,b). However, within the MCAO ipsi datasets we noticed the emergence of a canonical cellular stress response signature25, marked by the upregulation of several heat shock proteins (e.g. Dnaja1, Hsp90aa1, Hspa8, Hsph1) in GABA_Amb (Supplementary Fig. 7b). This signature mapped to a discrete subset of this cluster, which upon unsupervised subclustering analysis was revealed to be carried exclusively by misclustered oligodendrocytes but not neurons (Supplementary Fig. 7c–f). Hence, this cluster did not disclose a set of neurons with particular vulnerability to ischemia, but rather underpinned the responsiveness of neuroglia to ischemic injury. A full list of DEGs per cell cluster across all mentioned comparisons is provided in Supplementary Data 3. Collectively, neuroglia ranged among the most transcriptionally perturbed populations within our dataset, 48 h after MCAO.
Single-nucleus transcriptomics identifies stroke-specific oligodendrocyte lineage cell populations
Neuroglial cells are known drivers of regenerative mechanisms following stroke10,11, consist of highly heterogeneous subpopulations and are among the most transcriptional perturbed cell populations within our dataset. Therefore, we interrogated these cell populations in more detail. We first jointly sub-clustered OLIGO_1 and OLIGO_2. After manual removal of two clusters with evident neuronal transcript contamination (Supplementary Fig. 8a–d), 10 sub-clusters remained, which could be largely grouped according to canonical developmental stages of the oligodendrocyte lineage trajectory. Specifically, we identified two oligodendrocyte precursor cell clusters (OPC_0, OPC_1), one committed oligodendrocyte precursor cell cluster (COP), one newly formed oligodendrocyte cluster (NFOLIGO), two myelin-forming oligodendrocyte clusters (MFOLIGO_1 and MFOLIGO_2) and three mature oligodendrocyte clusters (MOLIGO_1 to MOLIGO_3) (Fig. 2a, b). Lastly, one sub-cluster faintly expressed markers of oligodendrocytes and immune cell-associated genes (Fig. 2a, b). Of note, the majority of immune cell transcripts within this sub-cluster were derived from the MCAO ipsi datasets (Supplementary Fig. 8e, Supplementary notes). Importantly, previous research has shown that oligodendrocyte transcripts accumulate in the nuclear compartment of phagocytic myeloid cells, giving rise to clusters expressing both oligodendrocyte and myeloid cell transcripts in vivo24. This cluster was thus annotated myeloid cell oligodendrocyte mixed cluster (MC_OLIGO). Details on marker gene curation are given in the supplementary notes. Notably, the two subclusters, OPC_1 and MOLIGO_1, were predominantly derived from infarcted brain tissue (Fig. 2c, d, Supplementary Fig. 8f).
Pseudotime trajectory analysis, which estimates the dynamic progression of cell states along a differentiation trajectory, indicated that the stroke-specific sub-cluster OPC_1 branched directly from the conserved sub-cluster OPC_0 (Fig. 2e). As expected, the mature oligodendrocyte clusters were associated to the highest pseudo time values. We identified a prominent trajectory bifurcation within MOLIGO_0, with one stroke-specific branch encompassing MOLIGO_1 and one branch extending to MOLIGO_2, which was conserved across all groups. Collectively these analyses suggest the emergence of an infarction-restricted OPC and a mature oligodendrocyte cell state. Notably, cell cycle scoring revealed that sub-cluster OPC_1 was derived from proliferating cells (Fig. 2f).
We next conducted DEG calculations for the oligodendrocyte lineage subclusters which were conserved across all groups (Supplementary Fig. 9a–c). Remarkably, the gene expression profiles of the conserved clusters differed little between the infarcted and contralateral hemisphere, with the exception of MC_OLIGO (Supplementary Fig. 9a), which was enriched in immune process and myeloid cell-associated genes in MCAO ipsi as described above. Likewise, the gene expression profiles of most conserved clusters were similar in the MCAO ipsi and Sham datasets, with the notable exception of OPC_0 (Total DEG: 50), MOLIGO_0 (Total DEG: 185) and MC_OLIGO (Total DEG: 98) (Supplementary Fig. 9b). Interestingly, substantial transcriptional differences between the hemisphere contralateral to infarction and Sham control datasets were only evident in subcluster MOLIGO_0 (Total DEG: 119) (Supplementary Fig. 9c). Importantly, 102 [96,23%] of the downregulated DEGs in the MOLIGO_0 subcluster in MCAO contra relative to Sham, were also identified in the comparison of MCAO ipsi to Sham (Supplementary Fig. 9d) and contained neurexins and neuregulins (e.g. Nrxn1, Nrxn3, Nrg1, Nrg3), as well as genes encoding neurotransmitter receptors, ion channels and ion channel interacting proteins (e.g. Kcnip4, Grm5, Kcnq5) (Supplementary Fig. 9e). Of note, the downregulation of many of these genes was subtle in terms of gene expression, as they were a priori expressed at low levels in the Sham dataset within the oligodendrocyte lineage clusters (Supplementary Fig. 9e). All DEGs, derived from all mentioned comparisons are reported in Supplementary Data 4.
We next investigated whether the infarction-restricted oligodendrocyte sub-clusters were conserved across both infarction severities. Importantly, both OPC_1 and MOLIGO_1 were identified in both moderate and severe infarctions, however particularly MOLIGO_1 nuclei were more abundant in severe lesions. All other clusters, as well as the expression of oligodendrocyte lineage cluster markers were well preserved across all datasets (Supplementary Fig. 10a–c).
We next interrogated how the MCAO ipsi-specific sub-clusters (OPC_1 and MOLIGO_1) differed transcriptionally from their homeostatic counterparts, via DEG analyses. Comparisons of OPC_1 to OPC_0 and MOLIGO_1 to MOLIGO_2 within the integrated dataset yielded a total of 519 and 384 DEGs, respectively (Fig. 2g, h, Supplementary Data 4). Conversely, direct cluster-wise comparison between the datasets derived from moderate and severe infarction did not yield substantial transcriptional differences and the key OPC_1 and MOLIGO_1 DEG signatures were well-preserved across both infarction severities (Supplementary Fig. 10d–f). Collectively, these findings indicate that the OPC_1 and MOLIGO_1 cell states emerge in both moderate and severe infarctions.
To gain insight into how the stroke-specific OPC_1 and MOLIGO_1 gene expression signatures might relate to changes in biological function we performed enrichment analyses (summarized in Supplementary Figs. 11, 12, Supplementary Data 5). We also systematically compared the signatures of OPC_1 and MOLIGO_1 to each other and to gene expression profiles of diseases associated oligodendrocytes (DAO), derived from various rodent models of neurodegeneration and demyelination26 (Supplementary Fig. 13, Supplementary Data 2). Transcriptional overlaps between stroke-specific oligodendrocyte lineage sub-clusters with DAO profiles were generally limited (Supplementary Fig. 13).
The vast majority of OPC_1 enriched genes mapped to cell cycle progression and proliferation-associated terms (Fig. 2i, Supplementary Figs. 11a–d, 14). Enrichment analyses further highlighted, the upregulation of several protein kinases and intracellular scaffold proteins, involved in phosphatidylinositol phosphate (PIP) binding (Supplementary Figs. 11a–d), of which many have been associated to OPC cell adhesion, migration, survival and differentiation, such as Iqgap127, Met28, Fyn29, or Axl30 (Fig. 2i, Supplementary Fig. 14). Several upregulated genes, such as Tnc, and various metalloproteases indicated extensive interactions of OPC_1 with the extracellular matrix (ECM) (Fig.2i, Supplementary Fig. 14). Notably, the canonical pan-reactive astrocyte markers Cd44 and Vim31,32, as well as Runx1 were enriched in both DAO and OPC_1. Runx2 was likewise upregulated in OPC_1, as well as the neuroprotective immunomodulatory alarmin Il3333. Interestingly, both Vim and Il33, have previously been shown to be upregulated upon injury in various oligodendrocyte lineage cells34,35. Notably, several growth factors, such as Ccnf, Vgf and Fgf2 were also upregulated in OPC_1. Conversely, we observed a downregulation of synaptic transmission-associated transcripts, particularly concerning potassium and glutamate homeostasis in OPC_1 (Fig. 2i, Supplementary Fig. 11e–h).
Of note, multiple biological processes associated with MOLIGO_1 enriched DEGs, for example Axonogenesis (GO:0007409), or Axon Guidance (R-HSA-422475) (Supplementary Fig. 12a–c) related to the modulation of neuritogenesis. Several genes encompassed by these gene sets, such as multiple upregulated sempahorines, have more extensive pleiotropic roles in physiological CNS development and pathology36. Similar to OPC_1 several MOLIGO_1 enriched DEGs were associated with ECM, as well as cell-cell interactions and glycosaminoglycan (GAG) metabolism (Fig.2i, Supplementary Fig. 12a–c). Many of the MOLIGO_1 enriched DEGs (e.g. Dlg1, Lamc1, Psem4, Sema5b, or Cadm1) were also expressed in less mature oligodendrocyte sub-clusters, but absent in the mature oligodendrocyte populations MOLIGO_0 and MOLIGO_2, in the Sham and MCAO contra datasets. Congruently, the expression of the canonical COP and NFOLIGO marker Bcas137 was markedly higher in MOLIGO_1 as compared to MOLIGO_0 and MOLIGO_2. Thus, several markers of more immature oligodendrocyte developmental stages were uniquely upregulated in MOLIGO_1, but not other mature oligodendrocyte clusters. Several MOLIGO_1 enriched DEGs were related to Notch, TGF-β and IGF-1 signalling, but also included more elusive signalling molecules, like the TIR-domain-containing adaptor (TRIF) recruiter Wdfy138 (Fig. 2i). Notably, several of the genes associated to Notch signalling by enrichment analyses (Supplementary Fig. 12a, Supplementary data 5), such as Il6st and Stat3 are also crucially involved in multiple type I cytokine signalling pathways39.
Regarding putative metabolic changes, we noted a robust upregulation of the 6-phosphofructo-2-kinase/fructose-2,6-biphosphatase isozyme 3 and 4 coding genes Pfkb3, Pfkb4, signifying a state of increased anaerobic glycolysis40. This was accompanied by a downregulation of aspartate/asparagine metabolism-related transporters (e.g. Slc25a13) and enzymes (e.g. Folh1, Aspa) and P-Type ATPases involved in lipid translocation (Atp10a,11a,11b) (Supplementary Fig. 12b, d, e, Supplementary data 5). Moreover, several myelination-associated genes were discreetly downregulated in MCAO ipsi-derived MOLIGO_1 transcriptomes as compared to MOLIGO_2 (Fig. 2i). Collectively, these findings did not implicate the infarction-restricted MOLIGO_1 cell state in remyelination, but suggest alternative functions.
Complementary to the calculation of DEGs between a priori-defined clusters, we identified genes which changed dynamically along the oligodendrocyte developmental trajectory and combined them into modules of co-regulated genes using Monocle 3. Remarkably, 5 gene-modules mapped uniquely to stroke-specific sub-clusters and mainly consisted of genes which were also identified as OPC_1 or MOLIGO_1 enriched DEGs (Fig. 2j, k, Supplementary data 6). The OPC_1 associated modules 4 and 11 consisted mainly of proliferation-related genes and mapped over the entire OPC_1 cluster. By contrast, module 5, which contained ECM-interaction, migration, survival and immunomodulatory process-associated genes appeared further down on the pseudo-temporal trajectory. The aggregate rank score of module 9 increased with incremental distance to the trajectory bifurcation within MOLIGO_0, indicating a dynamic progression from the MOLIGO_0 towards the MOLIGO_1 cell state, specifically within infarcted tissue. This module was permeated by abundant ECM and cell-cell interaction associated genes (e.g. Adamts1, Cadm1, Cldn14, Col12a1), as well as other genes, previously identified as MOLIGO_1 markers during DEG analysis, as described above (e.g. Stat3, Wdfy1).
Additionally, we inferred transcription factor (TF) activities using a molecular foot print based approach41. In congruence with the previous analyses several TFs for which increased activation was inferred within OPC_1 pertained to proliferation and survival-associated pathways, for example E2f1, or Myc42 (Fig. 2l). Notable TFs with increased activity in MOLIGO_1 included the hypoxia response related basic helix–loop–helix/Per-ARNT-SIM (bHLH–PAS) superfamily members Ahr and Hif1α43 and the STAT family members Stat3 and Stat5a. Conversely, the inferred activity of multiple hallmark TFs of oligodendrocyte differentiation and myelination, such as Olig144, Nkx2-245, or Rxrg46 was decreased in the MCAO ipsi derived MOLIGO_1 nuclei (Fig. 2l). In summary, using multiple complementary bioinformatics approaches we described the emergence of two transcriptionally unique oligodendrocyte lineage clusters within the infarcted hemisphere, marking the most robust cerebral ischemia induced change within the oligodendrocyte lineage in our dataset.
Proliferating OPCs accumulate at the perilesional zone
We next conducted Immunofluorescence (IF) staining to confirm the presence of stroke-associated proliferating OPCs in situ and interrogated their spatial distribution in the MCAO infarcted brain, 48 h after permanent filament-based MCAO in rats and thromboembolic MCAO in mice.
Overall, mitosis committed OPCs (NG2+/Ki67+) were almost absent in cortical grey matter (GM) and large white matter (WM) tracts of Sham-operated rats, sparse in the hemisphere contralateral to the infarct lesion, but abundant in the perilesional grey matter and affected white matter (Fig. 3). Furthermore, a substantial number of mitotic OPCs was also positive for VIM (Fig. 3), as predicted by snRNAseq analysis (Fig. 2). Specifically, while essentially absent in the GM and WM of Sham-operated rats (GM: 0/mm2; WM: 1.05 ± 1.2/mm2) and the hemisphere contralateral to infarction (GM: 0.3 ± 0.5/mm2; WM: 0.9 ± 1.1/mm2) the number of NG2+/VIM+/Ki67+ triple positive OPCs increased significantly in the perilesional GM (53.9 ± 18.3/mm2), affected WM (18.6 ± 5.1/mm2) (Fig. 3a–d) and lesion core (11.4 ± 8.2/mm2) (Supplementary Fig. 15a–c). We next investigated whether this OPC phenotype is conserved in an alternative MCAO model, with substantially smaller lesion volumes, in a different species (Supplementary Fig. 16). Congruently, VIM positive, proliferating OPCs, visualized using PDGFRα as an alternative OPC marker (=PDGFRα+/VIM+/Ki67+ triple positive OPCs) accumulated within the perilesional zone 48 h after thromboembolic MCAO in mice, but were only slightly and non-significantly enriched within the lesion core (Supplementary Fig. 17a–h)….

