Abstract
Despite the prominent role of the K-Ras protein in many different types of human cancer, major gaps in atomic-level information severely limit our understanding of its functions in health and disease. Here, we report the quantitative backbone structural dynamics of K-Ras by solution nuclear magnetic resonance spectroscopy of the active state of wild-type K-Ras bound to guanosine triphosphate (GTP) nucleotide and two of its oncogenic P-loop mutants, G12D and G12C, using a new nanoparticle-assisted spin relaxation method, relaxation dispersion and chemical exchange saturation transfer experiments covering the entire range of timescales from picoseconds to milliseconds. Our combined experiments allow detection and analysis of the functionally critical Switch I and Switch II regions, which have previously remained largely unobservable by X-ray crystallography and nuclear magnetic resonance spectroscopy. Our data reveal cooperative transitions of K-Ras·GTP to a highly dynamic excited state that closely resembles the partially disordered K-Ras·GDP state. These results advance our understanding of differential GTPase activities and signaling properties of the wild type versus mutants and may thus guide new strategies for the development of therapeutics.
Main
Ras proteins belong to a class of GTPase enzymes with a central role in the early stages of protein signal transduction, regulating cell growth, division and differentiation1. In its active form, Ras is bound to GTP, whereas in its inactive state it is bound to nucleotide guanosine diphosphate (GDP). Ras enzymatically converts GTP to GDP, a process that is accelerated in the presence of GTPase-activating proteins (GAP). Ras genes have been identified as the most frequently mutated oncogenes in human cancers, with Ras mutations associated with 19% of all cancers diagnosed in the United States and found in 3.4 million cases globally. Furthermore, as 75% of all Ras-associated cancer mutations occur in K-Ras, K-Ras has become the primary focus of Ras cancer research2.
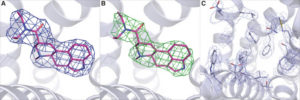
In recent years, X-ray crystallography has provided important information about the three-dimensional (3D) structure of K-Ras and its interactions with GDP, GTP and GTP analogs, and with several proteins including guanine nucleotide exchange factor (GEF), GAP and RAF3. The crystal structures also reveal the critical role of the Switch I (residues 30–38) and Switch II (residues 60–76) regions in protein–nucleotide interactions. However, although there is a single structure available of the wild-type (WT) K-Ras in an active GTP-bound conformation, most of the Switch regions are missing (Fig. 1a)4. Nuclear magnetic resonance (NMR) spectroscopy results indicate that the homolog H-Ras bound to the nonhydrolyzable GTP analog GppNHp dynamically populates multiple protein substates. Early studies using 31P NMR of the nucleotide revealed two states, termed states 1 and 2, slowly exchanging on the NMR chemical shift timescale5. State 2 is considered to be competent for downstream binding to effector proteins, and the equilibrium between the two states is shifted in favor of state 2 when K-Ras is bound to GTP or GTPγS6,7. Ras has also been studied via direct observation of some of its backbone NMR resonances. In another study of H-Ras bound to different GTP analogs, extreme NMR line-broadening in the Switch regions suggested the presence of conformational dynamics8. A subsequent 15N NMR Carr–Purcell–Meiboom-Gill (CPMG) relaxation dispersion analysis of H-Ras–GppNHp showed that the dynamics were distributed over different protein regions, although the properties of the Switch regions could not be studied owing to broadening of their resonances beyond detection9. Despite the missing Switch regions, a 15N chemical exchange saturation transfer (CEST) analysis of H-Ras provided the two substate populations and found large differences depending on whether native GTP or GTP analogs were used10. For GTP-bound WT K-Ras and the G12C and G12D mutants, around 80% of the backbone resonances were assigned recently, but the entire Switch II and a substantial number of resonances of Switch I were still missing11. As multidimensional NMR applications of Ras when bound to native GTP are impeded by the real-time hydrolysis of GTP, the addition of GEF was found to significantly extend the lifetime of H-Ras, allowing dynamics measurements of a larger number of residues, including several residues of the Switch regions12. A subsequent combined X-ray crystallography and one-dimensional 1H solution NMR study of WT K-Ras bound to GppCH2p found a significantly increased state 1 population compared with that of H-Ras, whereas the K-Ras G12D mutant favored state 2 (ref. 13). Together, these studies demonstrate that K-Ras behaves differently to H-Ras, with key properties of members of the Ras family being very sensitive to mutations10. It is therefore important to characterize the structural properties of K-Ras quantitatively and inclusively in its native GTP-bound context to provide a basis for understanding its enzymatic and signaling properties and the differences between the WT form and oncogenic mutants.
We report here backbone assignments along with comprehensive dynamics analysis of GTP-bound and GDP-bound forms of human WT K-Ras4B (residues 1–169) and its oncogenic mutants G12C and G12D, henceforth referred to as K-Ras, including the previously unobservable Switch I and Switch II residues. Experimental conditions for K-Ras·GTP were optimized to make it sufficiently stable over the time course of multidimensional NMR experiments for assignment and dynamics studies. This permitted essentially complete resonance backbone assignments of WT K-Ras·GTP and its G12C and G12D mutants, including the previously elusive yet functionally critical Switch I and II regions. Based on these assignments, the structural dynamics of K-Ras·GTP from picoseconds to milliseconds could be studied at a previously unobtained level of detail, using advanced NMR methods that provide unique insights into the function and the free-energy landscape of this system. These results reveal highly distinctive dynamic signatures for WT and mutant K-Ras·GTP and K-Ras·GDP.
Results
Sample preparation and resonance assignments
Despite years of NMR-based K-Ras research, many residues, including some in the key Switch I and II regions, could not be detected, and hence could not be assigned, seriously impeding the structural and dynamic characterization of this protein at atomic detail in solution. By improving the sample preparation and NMR measurement protocols (Methods), we detected and established essentially complete (>98%) backbone resonance assignments of GTP-bound WT K-Ras and its G12D and G12C mutants at room temperature (298 K). This is illustrated in the 2D 15N–1H heteronuclear single quantum coherence (HSQC) NMR spectrum (Fig. 1b) of WT K-Ras, which shows previously unobservable resonances in Switch I (red) and Switch II (blue). Although some of these peaks were significantly weaker than others or affected by peak overlap, such as D30, Y32, D33, T35, I36, E37 and D38 (Switch I) and G60, E62, E63, Q70, Y71 and E76 (Switch II), they were amenable to quantitative dynamics analysis. These advances were made possible by the optimized sample-preparation protocol, shortened NMR time using nonuniform sampling and the high sensitivity afforded by measurements at 850 MHz with a TCI cryoprobe. Notably, these results were obtained for the intact K-Ras enzyme in the presence of its native GTP substrate, with slow hydrolysis of GTP to GDP taking place during the course of the NMR experiment. To prevent t1-noise spectral artifacts due to enzymatic turnover changing sample composition, the order of the acquisition of increments along the indirect t1 dimension was randomized and interleaved with the number of scans while making use of minimal phase cycles. The backbone resonance assignments are complete to >98% (the few unassigned residues are listed in Supplementary Table 2). The availability of complete sets of resonances with high spectral quality allowed us to gain previously inaccessible, quantitative insights into the structural dynamic properties of K-Ras and its mutants.
NMR spin relaxation
Backbone 15N NMR spin relaxation experiments report on conformational dynamics of proteins over a large range of motional timescales. Here, we examined dynamics on (1) the microsecond to millisecond processes that are probed by CPMG and CEST experiments14,15 and (2) the picosecond-to-microsecond dynamics made accessible by nanoparticle-assisted spin relaxation (NASR)16 and traditional model-free analysis17. Figure 2 shows representative 15N CPMG relaxation dispersion and CEST saturation profiles of residues T35, I36 (Switch I), and E62 and Y71 (Switch II). Although these previously unobservable residues gave rise to some of the weakest 15N–1H HSQC cross-peaks (Fig. 1b), they could be unambiguously assigned and fully quantitatively analyzed in both CPMG and CEST experiments, as can be seen by the small error bars obtained for repeat experiments. The WT, G12C and G12D K-Ras displayed different degrees of relaxation dispersion, as shown in Fig. 2a, reflecting differences in the substate populations, differences in the chemical shift changes between the ground state and excited state, and differences in the interconversion rate constants (kex). High-quality 15N and 1H CPMG relaxation dispersion data and 15N CEST profiles were measured for all three K-Ras variants with 22 to 50 (nonproline) residues showing significant 15N exchange effects (Rex > 5 s−1, Table 1). The data were subsequently fitted to numerical expressions of conformational exchange using ChemEx18 software. Quantitative interpretation of the raw data was achieved with a global two-state exchange process parametrized by an exchange rate constant kex = k21 + k12 between the two dynamically interconverting substates 2 and 1 with populations p2, p1 = 1 – p2, and residue-specific chemical exchange differences Δϖ (Table 1)…