Abstract
Mitochondria are critical to the governance of metabolism and bioenergetics in cancer cells1. The mitochondria form highly organized networks, in which their outer and inner membrane structures define their bioenergetic capacity2,3. However, in vivo studies delineating the relationship between the structural organization of mitochondrial networks and their bioenergetic activity have been limited. Here we present an in vivo structural and functional analysis of mitochondrial networks and bioenergetic phenotypes in non-small cell lung cancer (NSCLC) using an integrated platform consisting of positron emission tomography imaging, respirometry and three-dimensional scanning block-face electron microscopy. The diverse bioenergetic phenotypes and metabolic dependencies we identified in NSCLC tumours align with distinct structural organization of mitochondrial networks present. Further, we discovered that mitochondrial networks are organized into distinct compartments within tumour cells. In tumours with high rates of oxidative phosphorylation (OXPHOSHI) and fatty acid oxidation, we identified peri-droplet mitochondrial networks wherein mitochondria contact and surround lipid droplets. By contrast, we discovered that in tumours with low rates of OXPHOS (OXPHOSLO), high glucose flux regulated perinuclear localization of mitochondria, structural remodelling of cristae and mitochondrial respiratory capacity. Our findings suggest that in NSCLC, mitochondrial networks are compartmentalized into distinct subpopulations that govern the bioenergetic capacity of tumours.
Main
NSCLC is a heterogeneous disease at a histological, genetic and metabolic level4. Mitochondria are essential regulators of cellular energy and metabolism, playing a critical role in sustaining growth and survival of tumour cells5. The mitochondria organize into dynamic networks such that the structural architecture of their outer and inner membrane dictates cellular electron transport chain (ETC) activity and respiratory capacity2,6. However, our understanding of how mitochondrial networks are structurally and functionally regulated in NSCLC at an in vivo level is limited.
To better understand mitochondrial bioenergetics in NSCLC, we recently developed and validated a voltage-sensitive, positron emission tomography (PET) tracer known as [18F]4-fluorobenzyl triphenylphosphonium ([18F]FBnTP)7,8. This tracer allowed us to measure relative changes in the mitochondrial membrane potential (ΔΨ) in autochthonous KRAS-driven mouse models of NSCLC9. PET imaging of NSCLC tumours in KRAS-driven genetically engineered mouse models (GEMMs) identified that lung adenocarcinoma (LUAD) and lung squamous cell carcinoma (LUSC) had distinctly different uptake values for the radiotracers [18F]FBnTP and 18F[FDG], suggestive of functionally distinct metabolic and bioenergetic phenotypes9. Therefore, we sought to determine whether [18F]FBnTP uptake in NSCLC tumours directly correlated with OXPHOS activity in vivo.
In vivo profiling of OXPHOS in NSCLC
To evaluate the OXPHOS signatures in NSCLC, we coupled PET imaging of lung tumours using the radiotracers [18F]FBnTP and [18F]FDG followed by ex vivo respirometry analysis of mitochondrial complex I and II activity (Fig. 1a). [18F]FBnTP was used to compare the ratio of mitochondrial ΔΨ in the tumour to that of the heart, whereas [18F]FDG was used to measure glucose flux in tumours. Representative [18F]FBnTP and [18F]FDG PET–CT images of KrasG12D;p53−/−;Lkb1−/− (KPL) and KrasG12D;Lkb1−/− (KL) mice identified synchronous lung tumours with differential uptake of the radiotracers (Fig. 1b and Extended Data Fig. 1a), as previously described9. Lung tumours with high [18F]FBnTP and low [18F]FDG uptake were denoted as [18F]FBnTPHI;[18F]FDGLO and glycolytic tumours with the opposite phenotype were termed [18F]FBnTPLO;[18F]FDGHI. In GEMMs, inactivation of Lkb1 drives the development of both LUAD and LUSC subtypes10. Therefore, we confirmed tumour subtypes by staining for surfactant protein C (SP-C) and TTF1 to verify LUAD histology and for glucose transporter 1 (GLUT1) and cytokeratin 5 (CK5) to verify LUSC histology, as previously described11 (Extended Data Fig. 1b–d).
The ETC generates a proton gradient to maintain ΔΨ and drive OXPHOS. Therefore, we examined whether uptake of [18F]FBnTP correlated with the OXPHOS activity in lung tumours. Following PET imaging, ex vivo respirometry was carried out on snap-frozen lung tumours that allowed for the direct measurement of complex I and II maximal respiratory capacity (MRC)12. Here OXPHOS signatures were defined by the combination of [18F]FBnTP tracer uptake and complex I and II MRC in tumours. We identified a threefold upregulation in complex I and II MRC in [18F]FBnTPHI tumours versus [18F]FBnTPLO tumours (Extended Data Fig. 1e,f). Analysis of mitochondrial respiration in LUAD and LUSC tumours from a larger cohort of KPL and KL mice identified a significant increase in complex I and II MRC in LUAD cells versus LUSC cells (Extended Data Fig. 1f,g). Our analysis of mitochondrial activity in KPL and KL GEMMs showed that LUSC cells had significantly lower OXPHOS signatures compared with those of LUAD cells.
Next, we broadened our correlative examination of complex I and II MRC and [18F]FBnTP uptake in GEMMs across five different genetic backgrounds: KPL and KL, as well as KrasG12D;p53−/− (KP), KrasG12D (Kras) and Lkb1−/−;p53−/−;Pten−/− (LPP) mice (Extended Data Fig. 2a,b). We identified a direct and significant correlation between [18F]FBnTP uptake and complex I and II MRC (Fig. 1c and Extended Data Fig. 2d,f). Clear histologic stratification was observed, as LUAD cells had higher [18F]FBnTP uptake and complex I and II MRC compared with those of LUSC cells (Fig. 1c and Extended Data Fig. 2d,f,h). Conversely, [18F]FDG uptake was inversely correlated with complex I and II MRC (Extended Data Fig. 2c,e,g).
We then evaluated [18F]FBnTP uptake and complex I and II MRC in human LUAD and squamous cell carcinoma (SCC) cell lines to determine whether OXPHOS signatures were conserved across species. The human LUAD cell lines (H1975 and A549), LUSC cell line (RH2), and head and neck squamous cell carcinoma (HNSCC) cell line (Tu686) were implanted into mouse tumour xenografts. H1975 and A549 tumours had significantly higher complex I and II MRC than tumours from RH2, Tu686 or A549 Rho cells (Fig. 1d and Extended Data Fig. 2i). We also confirmed that A549 Rho cells lacked expression of ETC proteins and uptake of [18F]FBnTP (Extended Data Fig. 2j–l). PET imaging of xenografts showed a significantly higher [18F]FBnTP uptake in H1975 tumours versus RH2 tumours (Fig. 1e, left). Conversely, RH2 tumours had significantly higher [18F]FDG uptake than H1975 tumours (Fig. 1e, right). Collectively, our results demonstrated that [18F]FBnTP uptake directly correlated with complex I and II activity in both human and mouse NSCLC. Although LUAD cells tended to have higher OXPHOS signatures than LUSC, given the heightened metabolic heterogeneity that is common to human NSCLC4, we anticipate that OXPHOS signatures may vary between NSCLC tumour subtypes.
PET-guided 3D SBEM imaging of NSCLC
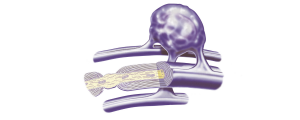
The fact that we observed functionally distinct OXPHOS signatures in NSCLC tumour subtypes suggests that these tumours may have equally distinct structural organization of their mitochondrial networks. To investigate this, we developed a workflow that paired functional PET imaging with micro-computed tomography (microCT) and ultra-resolution three-dimensional serial block-face electron microscopy13 (3D SBEM; Fig. 2a). The incorporation of microCT imaging allowed us to bridge gaps in resolution scales between whole-tumour imaging with PET and ultrastructure imaging with SBEM.